
Kubernetes Monitoring Best Practices
Kubernetes monitoring best practices covering metrics, logs, alerts, dashboards, SLOs, pod health, cluster health, and production observability.
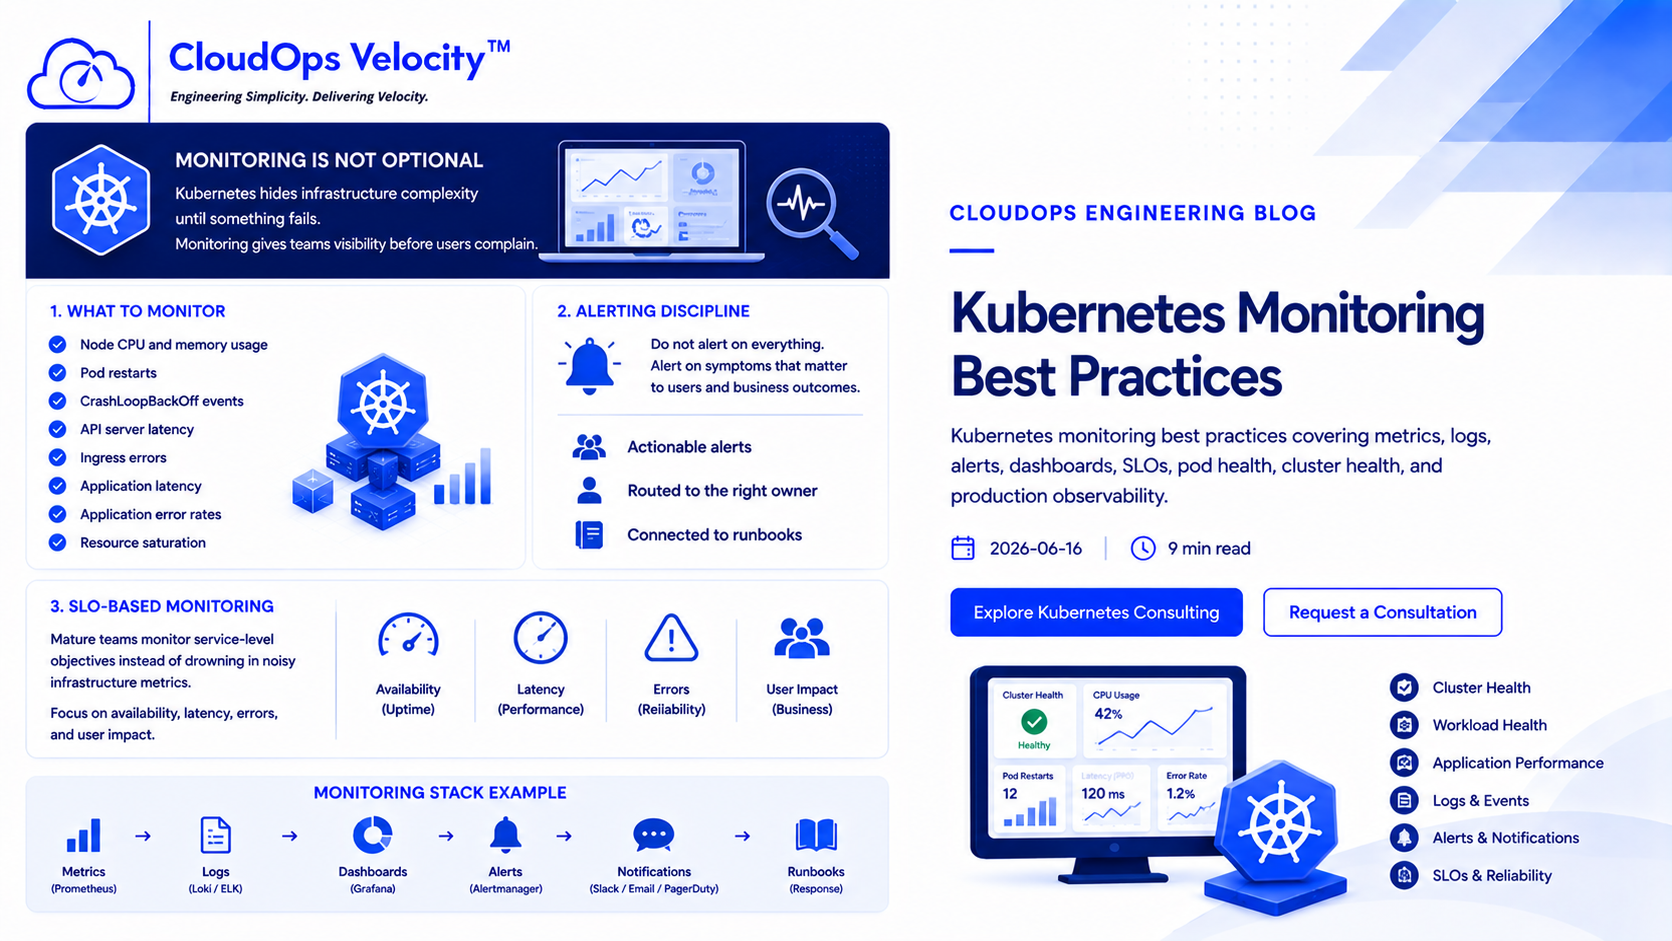
Monitoring is not optional
Kubernetes hides infrastructure complexity until something fails. Monitoring gives teams visibility before users complain.
Production Kubernetes monitoring should cover cluster health, workload health, application performance, logs, alerts, and service-level reliability signals.
What to monitor
Good Kubernetes monitoring includes cluster, workload, and application signals.
- ✓Node CPU and memory usage
- ✓Pod restarts
- ✓CrashLoopBackOff events
- ✓API server latency
- ✓Ingress errors
- ✓Application latency
- ✓Application error rates
- ✓Resource saturation
Alerting discipline
Do not alert on everything. Alert on symptoms that matter to users and business outcomes.
Good alerts should be actionable, routed to the right owner, and connected to runbooks or response steps.
SLO-based monitoring
Mature teams monitor service-level objectives instead of drowning in noisy infrastructure metrics.
SLO-based monitoring helps engineering teams focus on availability, latency, errors, and user impact rather than only raw infrastructure signals.
Ready to put this into practice?
If your engineering team needs help implementing these practices, we're here to help you architect, automate, and scale your infrastructure.
Frequently Asked Questions
What should you monitor in Kubernetes?
Monitor cluster health, node health, pod restarts, CPU, memory, latency, errors, saturation, logs, and application-level metrics.
Are Kubernetes dashboards enough?
No. Dashboards help visibility, but alerts, SLOs, runbooks, and incident response workflows are required for production operations.